Odoo Hackathon 2024
Cloud-Native web application deployed on GCP
Links & Resources
Description
Cloud-Native architecture deployed on Google Cloud Platform with Kubernetes, Docker, and React.
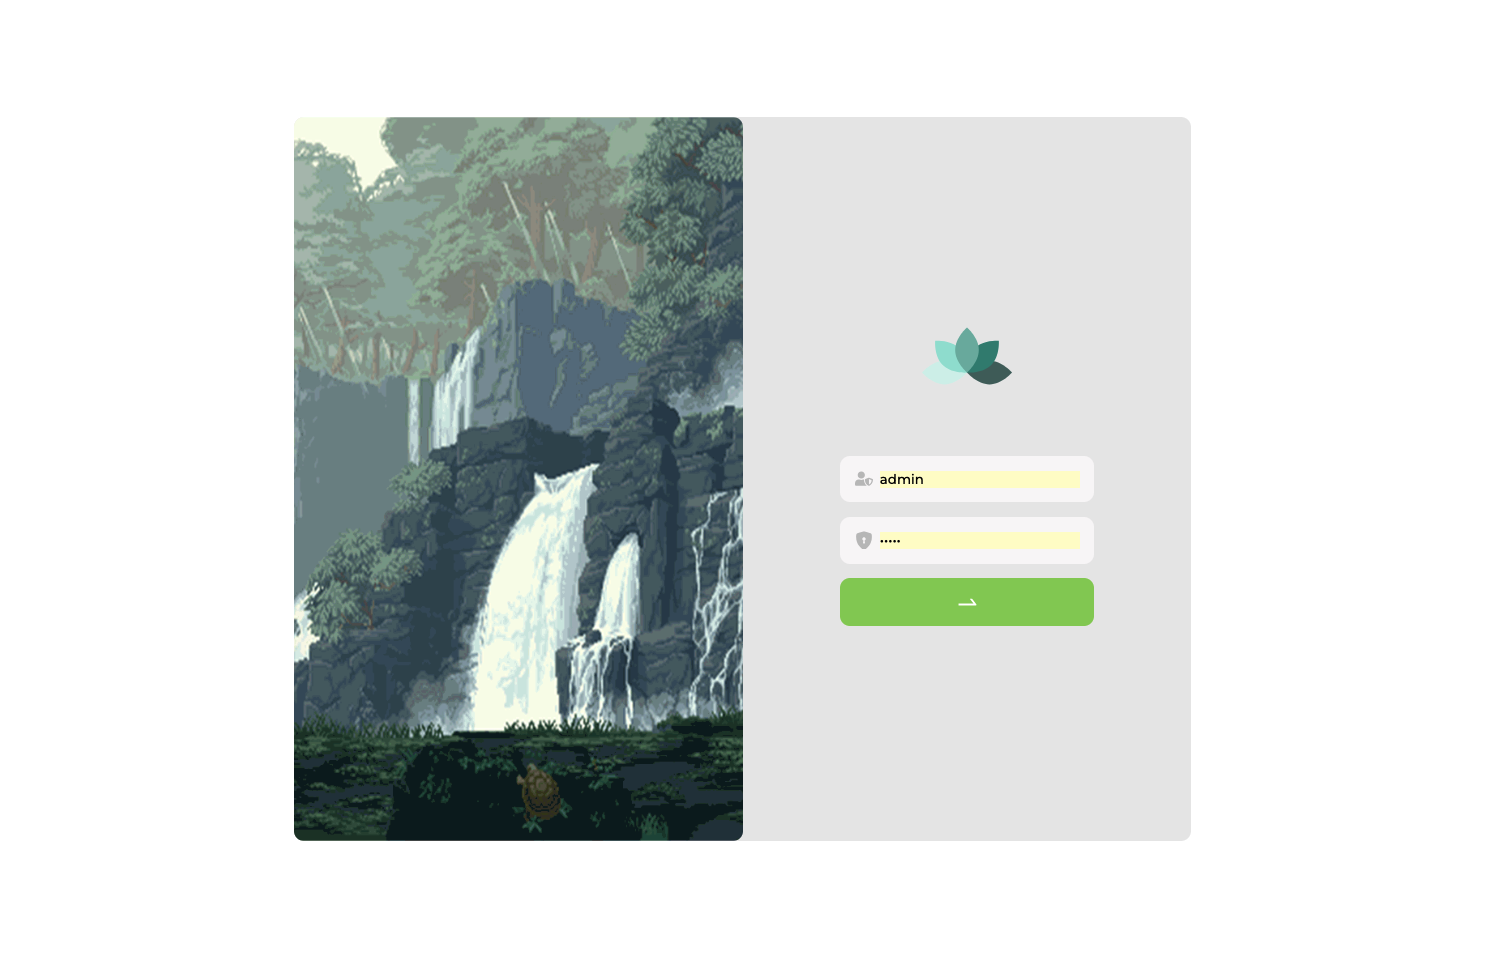
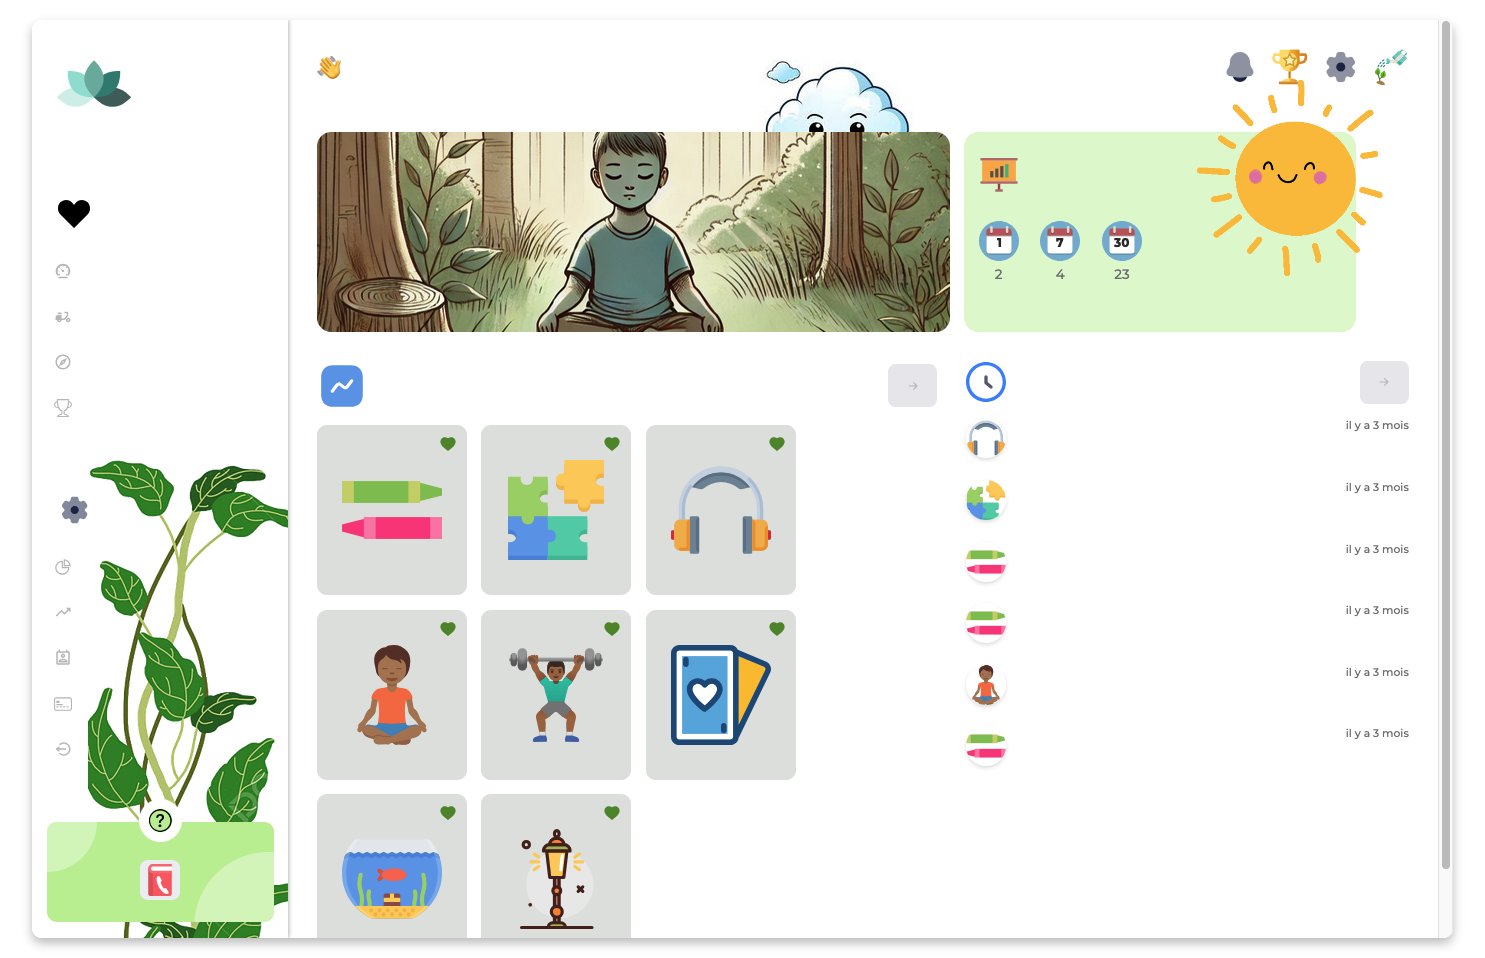
Odoo Hackathon is a modern web application demonstrating advanced DevOps technologies and modern distributed architectures, created during a development hackathon.


The application is built on a three-tier architecture, fully containerized and orchestrated. This project allowed me to deepen my DevOps skills and implement a complete infrastructure on Google Cloud Platform.
The technical stack includes:
- Frontend: React (Vite) with reusable component architecture
- Backend: Node.js/Express for a high-performance RESTful API
- Database: MariaDB for data storage
- Infrastructure: Kubernetes (GKE), Docker, Google Artifact Registry
- CI/CD: Continuous integration and deployment via GitHub Actions
Current deployment: After the hackathon, the application was redeployed to a private Raspberry Pi server where it runs 24/7, demonstrating its flexibility and optimization for diverse hardware environments.
The code is structured according to development best practices:
- Microservices architecture for optimal scalability
- Secure access and data protection
- Centralized monitoring and logging
- Automated testing and continuous integration
This project showcases my ability to design and implement complex cloud-native applications while following DevOps best practices and maintaining high standards of performance and security.
// Sample React code used in the project
import React, { useEffect, useState } from 'react';
import { LineChart, Line, XAxis, YAxis, CartesianGrid, Tooltip, Legend } from 'recharts';

const Dashboard = () => {
  const [data, setData] = useState([]);

  useEffect(() => {
    // Fetching data from the API
    fetchAnalyticsData().then(response => {
      setData(response.data);
    });
  }, []);

  return (
    <div className="dashboard-container">
      <h2>Performance Analytics</h2>
      <LineChart width={800} height={400} data={data}>
        <CartesianGrid strokeDasharray="3 3" />
        <XAxis dataKey="name" />
        <YAxis />
        <Tooltip />
        <Legend />
        <Line type="monotone" dataKey="value" stroke="#8884d8" />
      </LineChart>
    </div>
  );
};

export default Dashboard;